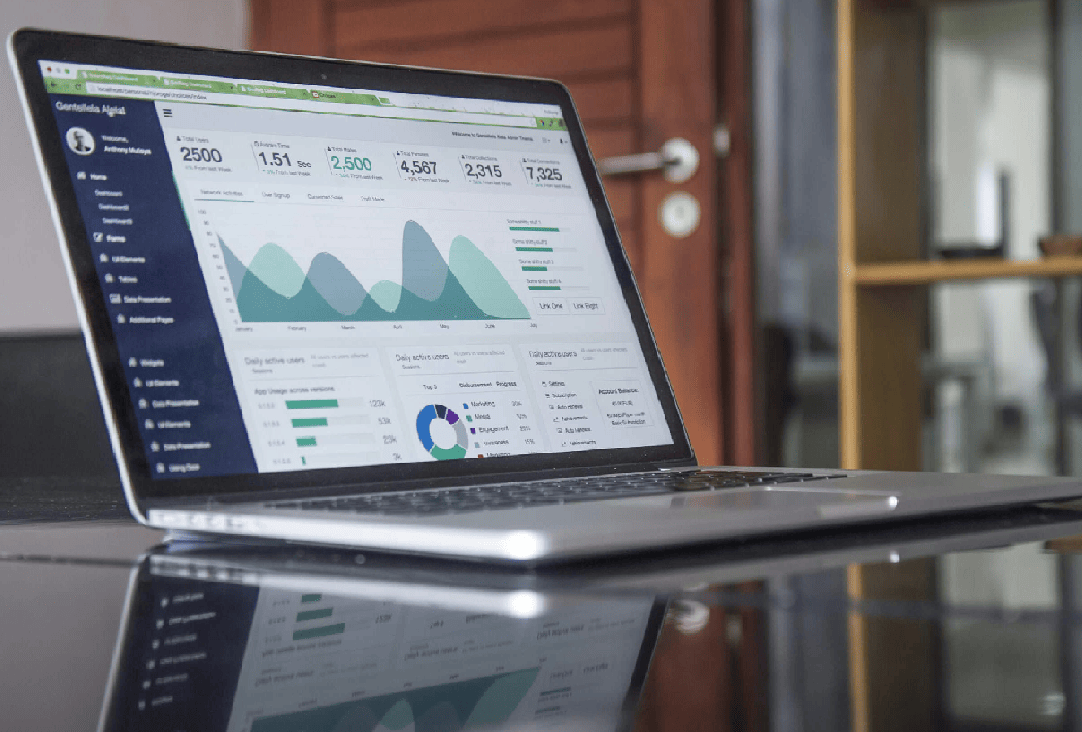
What are data and graphs?
Data is information that we collect about things, like numbers, measurements, or facts. Graphs are visual tools that help us organize and understand data easily. Instead of looking at long lists of numbers, graphs help us see patterns, trends, and comparisons quickly.
For example, if you survey your classmates about their favorite fruit and write down their answers, that’s data. If you organize that data into a bar graph showing how many people like apples, bananas, or oranges, it becomes much easier to compare the results.
Graphs are useful in school, business, science, and everyday life. They help us make better decisions, understand trends, and explain information clearly.
Who is the course suitable for?
Suitable for students in Grades 4 to 10, who want to improve their ability to read, create, and analyze graphs also helpful for students preparing for exams that involve data interpretation.
How does the course work?
There are 2 categories lower grade and higher grade, each containing various topics. You can customize your lessons to suit your needs by picking certain topics of interest. After a lesson students will be able to refine their skills by using Google Classroom with the support of their tutor. Students will also be able to go back and review important notes from completed lessons.
How do I dedicate a specific topic within my package?
You will be able to designate the hours included in your package to certain topics.
How much time should be dedicated to a topic or a category?
Depending on the student, the amount of time needed will vary. As your lessons progress, your tutor will guide you on when it is okay to move on to the next topic and will work with you to adjust based on your individual needs and progress.
Before starting the course you will be consulted via a Skype video call so that I can:
1. Learn more about you.
2. Show you how to use/set up Google Classroom and Khan Academy.
3. Help you set lessons, dates, times, and achievable goals.
4. Allow you to become more comfortable within the online learning environment.
What do I need to learn online?
Learning online is effective and convenient. It's most likely that you already have:
1. An internet connection with a speed of 10mbps.
2. A computer or laptop.
3. A webcam (preferred, but not necessary).
4. A comfortable spot in your home.
5. An email address.
What are the 7 topics within Measurement?
How can they help me? What will I learn?
Lower Grades (Grades 4-6)
Students will build foundational skills to understand and use data effectively.
Each topic will teach you how to:
- Identify different types of data (categorical and numerical).
- Collect and organize data into tables.
- Create and interpret bar graphs, pictographs, and line plots.
- Understand the basics of mean, median, and mode.
- Recognize trends and patterns in simple data sets.
Higher Grades (Grades 7-10)
Students will develop advanced skills in analyzing data and using various types of graphs.
Each topic will teach you how to:
- Work with line graphs, histograms, scatter plots, and box-and-whisker plots.
- Analyze and compare data sets using measures of central tendency (mean, median, mode) and range.
- Interpret and apply probability concepts.
- Understand misleading graphs and how data can be represented in different ways.
- Use graphs and data for problem-solving in real-world situations.
How this course will help you
- Develop critical thinking and analytical skills.
- Improve problem-solving abilities using real-world data.
- Strengthen graph-related skills for tests and assignments.
- Gain confidence in working with numbers, percentages, and statistics.

